
Where Concept and Science Deliver Hope

At Lyophilization Technology, Inc. we understand the unique thermal characterization of your product is key to successful product and process development. Paramount to starting this process is Low Temperature Thermal Analysis (LT-TA). LT-TA evaluates the bulk solution behavior during freezing and drying using varied thermoanalytic techniques at low temperatures. The goal is to quantify critical thermal transitions in preparation for freeze drying. The methods utilized include simple electrical resistance measurements (ER), freeze drying microscopy (FDM), and low temperature differential scanning calorimetry (LT-DSC). This activity provides significant data and warrants focus as a distinct step in the development process. Our stand-alone reports are suitable for submission to the agency.
Approximately 0.15 mL of solution is dispensed into a glass cell. The cell is then placed on a temperature-controlled freeze-drying stage. The sample cell is outfitted with two 40-gauge type T thermocouples positioned directly into the material at the bottom and center of the cell for monitoring sample temperatures.
As with the electrical resistance method, the microscopy stage is cooled at an average controlled rate to a target set point of below -50°C. Upon the completion of freezing, the stage chamber is evacuated to initiate sublimation of ice. The stage is then warmed at an average controlled rate during sublimation and drying.
Behavior of the sample during freezing and drying is observed using an Infinivar Microscope, capable of magnification from 16 to 330X, coupled to a Sony CCD Color Camera. Observed changes in the frozen and dried portions of the sample, reflective of the material exceeding a phase transition, are correlated with the sample temperatures. Temperature measurements are recorded every ten seconds during the complete analysis. After completion of the experiment, data is converted to an Excel® spreadsheet for graphing.
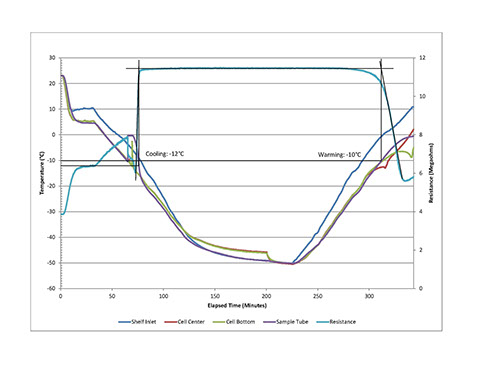 The electro-kinetic measurement of Electrical Resistance detects, as a function of temperature, the changes in electrical conductivity associated with a material between its liquid and solid state. Resistance is measured on approximately 1.8 mL of sample in a 20mm glass sample tube using a 0 to 20 megohm resistance instrument and a ceramic resistance probe consisting of two parallel gold strips on a ceramic plate substrate. Temperature is measured using a 32-gauge type T thermocouple located at the ceramic probe on the opposite side of the gold plates.
The standard method cools and warms the material at an average controlled rate of 0.5°C per minute to assess its thermal characteristics. The results of this analysis are useful to establish a material-specific phase transition. The resistance sample is analyzed at atmospheric conditions. A deviation of resistance is used to determine an onset of the phase transition upon warming.
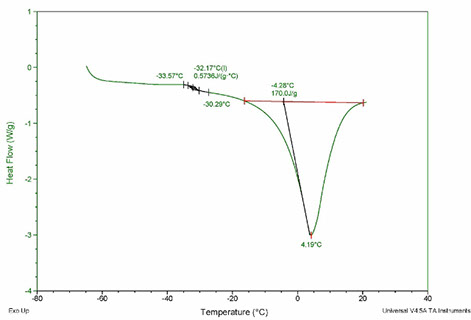 Low Temperature Differential Scanning Calorimetry (LT DSC) is used in conjunction with the Electric Resistance and Freeze Dry Microscopy as a means of assessing physico-chemical behavior and determining phase transitions during freezing and warming. LT DSC follows the current USP<891> .
Approximately 5 to 15 mg of solution is placed in an aluminum sample pan with a lid sealed in place. Nitrogen, NF is used to purge the sample chamber continuously at a flow rate of 50 mL/minute. The instrument is routinely calibrated at temperatures that span the range of low temperature analysis.
The aqueous sample is cooled to an ultimate temperature for freezing and subsequently warmed at a controlled rate for analysis. During cooling and warming, evolution or uptake of heat from the sample reflects the differences in energy as the material undergoes a thermal event. The cooling and warming scan data is recorded and graphed simultaneously using the Advantage software. Calculations identify the temperature at the onset and peak of a thermal event once the scan is complete. Based upon the results of the scan, temperatures, changes in enthalpy, and/or changes in specific heat are determined for thermal events such as glass transitions (Tg’), crystallization and melting points.